This article examines how the United States, Russia, China, Saudi Arabia and other nations support military conflicts, an economy which seeks profits through conflicts and politics, and the weapons industry, or what is called the Military Industrial Complex in the Defense Iron Triangle. This analysis will show that the politics and economics go beyond a defense of nations into profiteering and policymaking that cost tens of millions of lives and trillions of dollars per generation. It will show the establishment of modern conflict zones and the players involved.
What has been found is not the selling better bows to natives; it is intentional international selling of weapons that destroy nearly everything in their path – just look at the ancient cities of Aleppo and Baghdad and see the loss of lives, governments, communities, schools, education, structures, health, opportunities, religion and antiquities. But hey; arm sales and conflicts help drive the bloody Financial Markets – so who in governmental power gives a care about truth, morals and the loss of mere uneducated souls in underdeveloped regions.
This work is written in several parts and sections – Table of Contents:
- Definitions
- The Cost
- Cost per Death and $20 Trillion Global Cost
- The Children: Extreme Situation
- Top Military Spending Countries (Exporters and Importers)
- Top Weapons Manufacturers
- The Conclusion
Definitions
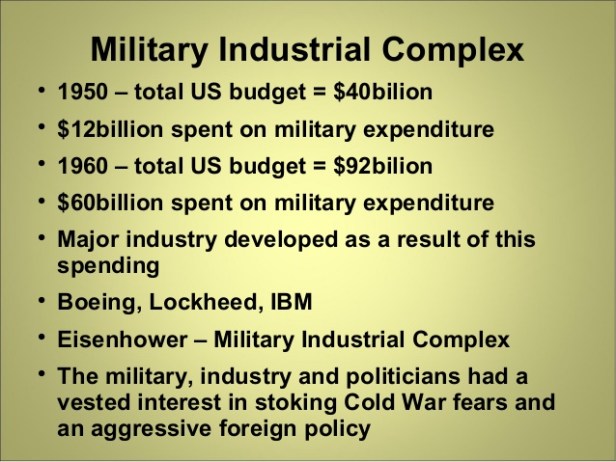
Military Industrial Complex: The network of individuals, corporations and institutions involved in the governing, overseeing and production of weapons (Arms) and military technologies; it has been referred to as the Pentagon System, and was exposed by President Eisenhower (1960s).
Iron Triangle: A reciprocal (mutual or shared) three-way arrangement between Congress (Oversight Committees), government bureaucrats (such as at the Department of Defense – Pentagon), and Corporate Industries (such as the Defense/Weapons Industry) represented by their special interest groups (primarily lobbyists).
Nations support military conflicts: Refers to the fact that nations or countries; through alliances, special interest lobbying, policymaking and media propaganda support by policy, budgets and actions the continuations of wars and military conflicts (major military fights and actions with the use of extreme arms power between two or more factions, nations or states).

Above: The ancient city of Aleppo (Halab); older than 3,000 B.C.; once capital of Amorites
THE COST
According to a paper by Brown University’s Watson Institute for International & Public Affairs, Costs of War: US Budgetary Costs of Wars through 2016: $ 4.79 Trillion and Counting…, “Wars costs money before, during and after they occur – as governments prepare for, wage, and recover from them by replacing equipment, caring for the wounded and repairing the infrastructure destroyed in the fighting… As of August 2016, the US has already appropriated, spent or taken on obligations to spend more than $3.6 trillion in current dollars on the wars in Iraq, Afghanistan, Pakistan and Syria and on Homeland Security (2001 – 2016). To this total should be added the approximately $65 billion in dedicated war spending the Department of Defense and State Department have requested for… 2017, along with an additional nearly $32 billion for …Homeland Security in 2017, and estimated spending on veterans in future years. When those are included, the total US budgetary cost of the wars reaches $4.79 trillion.
The Watson Institute article on Costs of War reported that the cost of war in the Middle East through 2014 for the US was estimated at about $4.4 trillion, and that “future obligations will total …$1 Trillion in medical and disability payments and additional administrative burden through 2053…” For these reasons some say that the Middle East conflict/wars just through 2017 will cost over $7 trillion of current and future Americans.
Another 9/9/2016 article by the Watson Institute on the Costs of Wars, US spending on Middle East wars reach $4.79 trillion in 2017, stated that with “interest on funds borrowed to pay those bills could climb to $7.9 trillion by 2053.”
This does not take into the future cost directly and indirectly incurred by these wars – including future terrorist’s attacks in America and other countries which we give AID to due to terrorism. Thus, $8 Trillion dollars to make regime changes in the Middle East – and of course increase the cost of oil and the supply and demand for Military Weapons and defense communications and systems and reconstruction and other such contracts. For the taxpayer and moral citizen; it seems taking assassinations contracts out of certain government presidents, terrorist leaders and making surgical strikes on groups along with appropriate propaganda would be less costly to lives and government coffers.
But the truth is central banks lend to governments who are significantly more moved by corporate lobbyists, Bilderberg meetings, and foreign interests than the voice of the average citizens of this government “for the people and by the people…” The global costs of recent Middle East conflicts likely exceed $20 trillion.
| Cost to kill one person = $ 4.8 trillion ÷ 1.17 million deaths or $ 4.1 million per person |
Maybe the ancient Romans and others had it right when they felt the need for regime changes (just assassinate the leaders). U.S. Budget for Wars 2001 to mid-2016: about $ 4.8 Trillion; direct war death toll in Iraq, Afghanistan and Pakistan 2001 to mid-2016: 370,000 or $13 million to kill ONE targeted ‘enemy;’ actual deaths in those nations included ‘at least 800,000 more indirect deaths’ including 200,000 civilians (Watson.brown.edu; 2017). Cost per person = $ 4.8 trillion ÷ 1.17 million deaths or $ 4.1 million per person. This does not include the budgets of other nations or the half million that the Assad regime killed in Syrian genocide or that ISIS killed. Nor does it include the present and future associated cost for healthcare, refugees and orphans, or loss of our goodwill and future hate and actions by extreme terrorists that wars make. Defense is needed; and fighting for the weak; but there has to be a better way – let the champions of each country fight – televised it to raise money for past victims of war; or just kill the wicked leaders that commit genocide and threaten mankind – like Basher Assad and Kim Jong-un; others will likely take notice – even in Russia and North Africa.

OTHER COSTS ($10 Trillion and Lives)
| February 2016 The Middle East Monitor reported in their article The Real Cost of Middle East Wars, “Millions of Muslims have lost their lives in the occupations of Iraq and Afghanistan and in fighting in Libya, Syria and Yemen. Thousands of women, children, elderly people, youngsters and other innocent people are being added to the list every day. As one part of the world dies, another produces reports praising the war machinery that it employs.
These wars have become a kind of convention for new weaponry. The US first used its new B2 bombers in the fighting in Afghanistan and Libya. The unmanned aerial vehicles known as drones were first used by the CIA in Pakistan. The $75-billion F22 Raptor aircraft had to wait for the Syrian civil war. F35 fighters, on which $400 billion has been spent to date out of a $1 trillion budget, are waiting their turn to rain down death and destruction. Russia has not been slow to take part in this arms exhibition. It first put its Tupelov TU-160 warplanes, Raduga Kh-101 cruise missiles, new mechanised howitzer the MSTA-B and S 400 missile system on show in the Syrian civil war. France showcased its Rafale fighter aircraft in the Libyan and Syrian civil wars. Russia also launched its 3M-14 missiles with their 1,500 mile range at targets in Syria from the Caspian Sea. Each new weapon competes to cause greater killing and devastation. Success in the arms race is measured in the amount of innocent blood spilled. The reward for the winners is international praise and money to commit new slaughter. New weapons introduced by one side leads the other bloc to develop an even better one. While money is spent on developing a weapon, billions of dollars are also diverted to develop defence systems to counter it. The world’s resources are more than adequate to feed, house and provide pleasant lives for its 7 billion inhabitants, yet these countries spend their wealth, not on keeping people alive, but on the means to kill them. The money spent on arms represents only a very small part of the total cost of wars. Several think-tanks have calculated the cost to the US economy of the wars in Iraq and Afghanistan at $6 trillion. A large part of the cost represents expenditure not on the battlefield but on indirect costs. In addition to the $2 trillion it has already spent, the US will spend another $4 trillion over the next 30 years in loan interest, new arms purchases and lifetime health costs for injured veterans. One week before the start of the Iraq War, the then US Vice President Dick Cheney said that it would last only 2 years and would cost around $100 billion. However, the conflicts have never ended, and the cost has been at least 40-50 times higher. The world is becoming an ever more dangerous place, with the side-effects of wars that cannot be measured in money. Billions of dollars are being spent on security alone… In its peace report for 2014, the Institute for Economics and Peace revealed that 81 countries have gradually become more dangerous places, including Syria, Iraq, Yemen, Libya, Israel and Lebanon. The annual cost of the climate of violence in these six countries alone is $300 billion. The annual cost to the world due to violence is estimated at $10 trillion. Of that, $3 trillion represents the costs of obtaining arms; $3 trillion is related to crime and personal violence (murders, violence… sex crimes and prison expenditure), $2.2 trillion for domestic security and $1.2 trillion for the cost of regional or global conflicts. Instead of this money being spent on preventing hunger, poverty and the deaths of homeless children, and raising prosperity across the world, it is being wasted on a dead-end from which there can be no winners…” https://www.middleeastmonitor.com/20160203-the-real-cost-of-middle-east-wars/ |
According to the World Bank (February 2016), “In 2016, about 87 million people from the four MENA countries directly affected by war—Iraq, Libya, Syria, and Yemen—represent about one third of the region’s population. In these countries, every aspect of people’s lives—home, clinic, school, work, food, water—has been affected by the intensity of the fighting in these separate conflicts… The statistics are startling: about 13.5 million people need humanitarian aid in Syria; in Yemen, 21.1 million; in Libya, 2.4 million; and in Iraq, 8.2 million. In Yemen, 80% of the country’s population—20 million out of 24 million people—is now considered poor, an increase of 30% since April 2015, when fighting escalated. In Syria and Iraq, per capita income is 23% and 28% less respectively… Syria’s war has displaced half its population—more than 12 million people…”
The Institute for Economics & Peace (IEP) 2014 report, A Comprehensive Assessment of the Global Cost of Violence, stated “the global impact of violence containment is $9.46 Trillion.” IEP’s 2017 Global Peace Index report said that “Iceland remains the most peaceful country in the world… Syria remains the least peaceful country… (then) Afghanistan, Iraq, South Sudan and Yemen… Violence Costs 12.6% of World GDP… The economic impact of violence on the global economy in 2016 was $14.3 trillion in purchasing power parity (PPP) terms… $1,953 for every person… the economic impact from losses from armed conflict (war) was $1.04 trillion; military spending …$5.62 trillion, internal security spending $4.92 trillion… Due to armed conflict in MENA, many related indicators such as deaths from internal conflict, number of refugees and IDPs… are at high levels.” (IDPs – Internally displaced persons; MENA – Middle East & N. Africa)


Cost per Death and $20 Trillion Global Cost
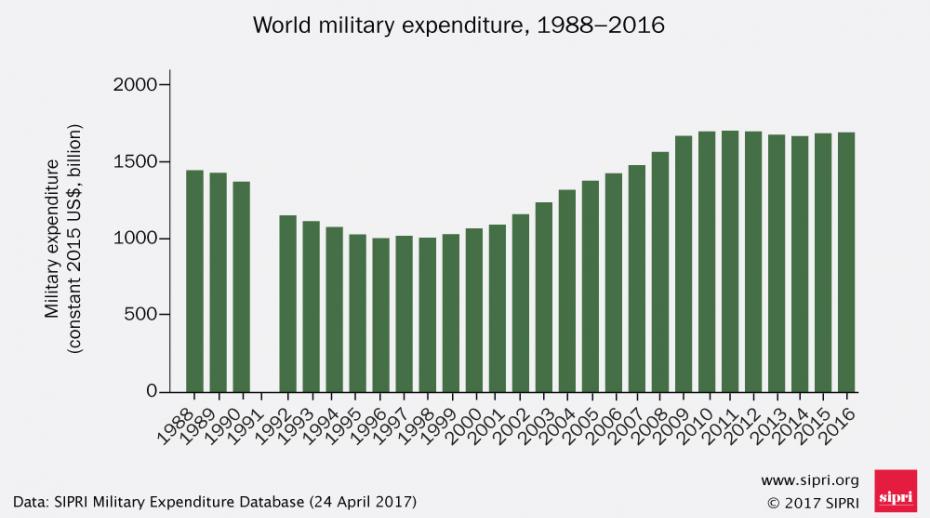
There have been more than 250 wars and armed conflicts since WWII. It is estimated that about 2.3% of Global GDP is spent on Military Arms, Security and Defense. That is $2.30 of every $100 of Gross Domestic Products. And in Syria alone, analysts estimate that the Syrian economy will need more than $1 trillion to recover from the civil war. In 2016, about $1.4 trillion was spent globally on military spending. The United States has gone from under $4 trillion in national debt in 1991 to $ 20 Trillion in July 2017; which is about the same amount that has been spent on war and conflicts since 1991 or the last generation (25 years).
The average spent on defense and military spending (not including foreign and UN Aid) was about $500 billion per year; though when including healthcare, aid, interest and future cost, SIPRI show closer to a trillion a year by America. Taking the facts that global military spending was over $20 trillion for the last 25 years; and offsetting future interest with past and present spending for a reasonable defense in countries around the world; the cost per death is then calculated by dividing the $20 trillion expenditure by the number of deaths during the period. According to the American Journal of Public Health (June 2014), “civilian war deaths constitute 85% to 90% of casualties caused by war, with about 10 civilians dying for every combatant killed in battle.”
| A Generation of War: Global 1991 – 2016
$ 20 Trillion & Tens of millions of children displaced and unschooled Approximately 7.5 million deaths Cost per death: $ 2.6 Million = $18,000,000,000,000 ÷ 7,500,000 A Generation of War in MENA (the Middle East and North Africa) = 7+ million deaths 1991 – 2016 – by weapons, starvation, disease |
WARS and CONFLICTS Data (20th Century and to 2017) see:
http://www.war-memorial.net/wars_all.asp
http://www.scaruffi.com/politics/massacre.html
According to The Telegraph article Global cost of war reaches $14 Trillion (June 2015), “More than $14 trillion was spent on international conflicts in the past year, according to a report by the Institute of Economics and Peace (IEP), which found that Syria, Iraq and Afghanistan were responsible for a surge in war deaths. The spending represents 13% of global GDP… IEP Chief Executive said, ‘…If global violence were to decrease by 10%, an additional $1.43 trillion would effectively be added to the world economy.’ …The report also indicated how those killed in conflicts had risen more than 350 per cent so far this decade, from 49,000 in 2010 to 180,000 in 2014. This occurred amid a 61% increase in terror-related deaths in 2013 with 18,000 people killed. Most of these occurred in just five countries: Afghanistan, Iraq, Nigeria, Pakistan and Syria.” Also, the United Nations in March 2017 reported that “more than 20 million people” in North Africa are subject to starvation and disease and millions more in the Middle East.
The Children: Extreme Situation
According to the September 2015 Education Under-Fire Report by UNICEF, the United Nations Children’s Fund, “More than 13 million children are not attending school in countries being affected – either directly or indirectly – by armed conflict… It is estimated that there are more than 8,850 schools in Syria, Iraq, Yemen and Libya that can no longer be used… attacks on schools and education infrastructure – sometimes deliberate – are one key reason many children do not attend classes.” And the situation is only worst in 2017, with continued genocide in Syria, wars and conflicts in the MENA region, the refugee crisis, orphans and war babies.
Orphans: Crisis from War and Aids
Child Martyrs: ISIS, Al-Qaeda, & other Islamic Extremists
https://www.unicef.org/mena/media_10557.html
Top Military Spending Countries
There are three (3) major or significant parts to Nations supporting military wars and conflicts: Production and uses – Defense and Exports; Importing – Defense and Sales; and the Group using the Arms/Weapons and Military Systems. About 2.3% of Global GDP is spent on Military Arms, Security and Defense. That is $2.30 of every $100 of Gross Domestic Products.

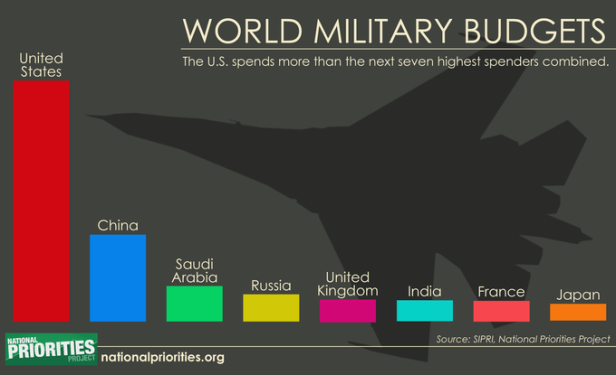
The United States is by far the top Exporter of military weapons and systems, three times more than Russia and nearly equal to eight other nations in the top 10 exporters list, excluding Russia. From January 2013 to June 2017, the U.S. exported more than $ 100 Billion in military related weapons and systems. More over May 2017, during President Trump’s visit to Saudi Arabia, a $110 billion arms sale was announced. It was a huge increase over the Obama Administration agreements; but as of mid-2017 only about $25 billion is in the pipeline.


According to SIPRI (Stockholm International Peace Research Institute / sipri.org) February 2017, “the volume of international transfers of major weapons has grown continuously since 2004 and increased by 8.4% between 2007 to 2011 and 2012 to 2016… The five biggest exporters – the United States, Russia, China, France and Germany – together accounted for 74% of the total volume of arms exports… Saudi Arabia was the world’s second largest arms importer in 2012 to 2016, with an increase of 212 percent compared with 2007 to 2011… With a one-third (1/3) share of global arms exports, the USA was the top arms exporter 2012 to 2016… Almost half… went to the Middle East. ‘The USA supplies major arms to at least 100 countries around the world – significantly more than any other supplier state,’ said Dr. Aude Fleurant, Director of the SIPRI Arms and Military Expenditure Programme. ‘Both advanced strike aircraft with cruise missiles and other precision-guided munitions and the lastest generation air and missile defense systems account for a significant share of US arms exports.’
Russia accounted for a 23% share of global exports 2012 to 2016; 70% of its arms exports went to 4 countries: India, Vietnam, China and Algeria. China’s share of global arms exports rose from 3.8 to 6.2% between 2007 to 2011 and 2012 to 2016… Algeria was the largest arms importer in Africa with 46% of all imports to the region. The largest importers in sub-Saharan Africa – Nigeria, Sudan and Ethiopia – are all in conflict zones. Imports by Azerbaijan were 20 times higher than those of Armenia in 2012 to 2016…”
According to the Al-Jazeera article (Feb. 2017), The 10 Countries that export the most major weapons, “The global trade in heavy arms has skyrocketed to its highest level since the cold war… Between 2012 and 2016, imports by countries in the Middle East region skyrocketed by 86%, accounting for 29% of global weapons purchases. Globally, India, Saudi Arabia and the United Arab Emirates were the most prolific importers of major weapons…” The article shows that for Global arms trade in 2016; 10 countries accounted for 90% of the global arms trade with $28 billion of the $31 billion in Total Arms Trade sales.
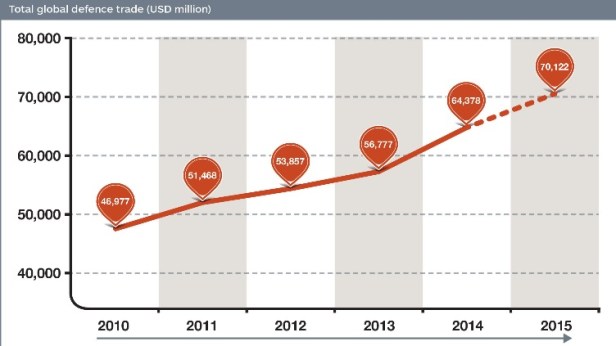
Worldwide, the defense trade reached a record high of US$65 billion in 2015, according to Jane’s reports. “The global defence trade market has never seen an increase as large as the one we saw between 2014 and 2015,” said Ben Moores, a senior defence analyst at HIS Aerospace, Defense & Security. IHS’ 2014 Global Defense Trade Report showed that Saudi Arabia has replaced India as the largest importer of defense equipment.
Weapons and ammunition in circulation (Amnesty.org; Aug. 2015)
- Total current military stocks of China, USA, Russia, India, France and UK:
15,426 Battle tanks
17,816 Armoured combat vehicles
36,621 Large calibre artillery systems
7,644 Combat aircraft
1,485 Attack helicopters
269 Warships
527 Heavy unmanned aerial vehicles
[Source: The Military Balance] - 875 million small arms and light weapons are estimated to be in circulation worldwide. [Source: Small Arms Survey]
- Between 700,000 and 900,000 small arms are produced annually. [Source: Small Arms Survey]
Most of the world’s 875 million small arms are firearms in civilian hands, which total approximately 650 million. They range from collectible antiques to state-of-the-art automatics. Civilian ownership is the fastest-growing category, as consumers buy more guns and as former military and law enforcement weapons gradually shift into civilian hands.
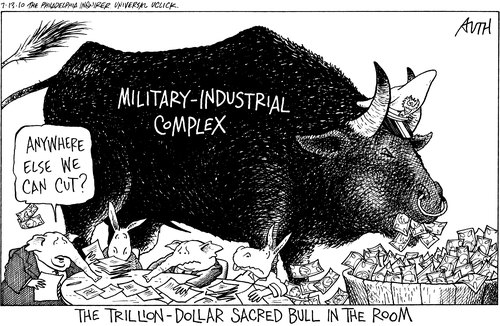
According to Wallstreetwindow.com, “The United States spends almost 40% of its Federal budget, when you account for the interest on past defense expenditures and wars. It amounts to close to a trillion dollars and is the biggest contribution to the nation’s budget deficit. And the costs of weapons and wars are simply going up…
The United States used to purchase 5-16 fighter jets that cost $47 million a plane and now buys F-22 fighter jets that cost $137 million a unit. In reality when you factor in the money spent on research and development the F-22 is costing the US government $678 million a plane.

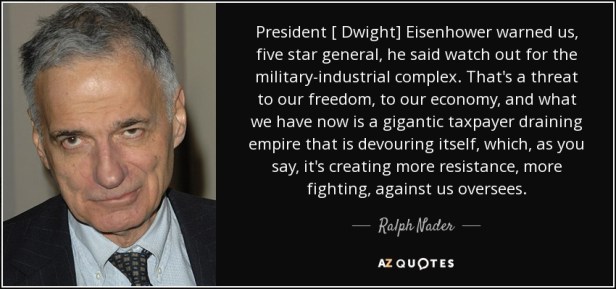
Dwight Eisenhower delivered one of the most famous farewell addresses a President ever gave just as he left office in 1960. In it he said ‘we must guard against the acquisition of unwarranted influence, whether sought or unsought, by the military industrial complex’.”
The top 10 importers and exporters of major arms, 2010–14
Exporter Global share (%)
1. USA 31
2. Russia 27
3. China 5
4. Germany 5
5. France 5
6. UK 4
7. Spain 3
8. Italy 3
9. Ukraine 3
10. Israel 2
Importer Global share (%)
1. India 15
2. Saudi Arabia 5
3. China 5
4. UAE 4
5. Pakistan 4
6. Australia 4
7. Turkey 3
8. USA 3
9. South Korea 3
10. Singapore 3
According to the Congressional Research Service, December 19, 2016, article Conventional Arms Transfers to Developing Nations, 2008-2015, C. Theohary, a Specialist in National Security Policy writes, “…Recently, from 2012 to 2015, the United States and Russia were predominant the arms market in the developing world, with both nations either ranking first or second in all but the most recent in these four years in the value of arms transfer agreements. From 2012 to 2015, the United States made nearly $86 billion in such agreements, 33.38% of all these agreements (expressed in current dollars). Russia made $48.6 billion, 18.94% of these agreements. During this same period, collectively, the United States and Russia made 52% of all arms transfer agreements with developing nations, ($134 billion in current dollars)…”
“…Although the global total in weapons sales in 2015 represents an increase, the international arms market is not likely growing overall. The U.S. global total for arms agreements in 2011 appears as an outlier figure, representing large sales with Saudi Arabia worth approximately $33.4 billion. Moreover, there continue to be significant constraints on its growth, due, in particular, to the weakened state of the global economy. The Eurozone financial crisis and the slow international recovery from the recession of 2008 have generally limited defense purchases of prospective customers. Concerns over their domestic budget problems have led many purchasing nations to defer or limit the purchase of new major weapon systems. Some nations have chosen to limit their purchasing to upgrades of existing systems and to training and support services. Others have decided to emphasize the integration into their force structures of the major weapon systems they had previously purchased. Orders for weapons upgrades and support services can still be rather lucrative, and such sales can provide weapons suppliers with continued revenue, despite the reduction in demand for major weapon systems…”
“…It was not until the Iran-Iraq war in the 1980s that China became an important arms supplier, one willing and able to provide weaponry when other major suppliers withheld sales to both belligerents. During that conflict, China demonstrated that it was willing to provide arms to both combatants in quantity and without conditions. Subsequently, China’s arms sales have been more regional and targeted in the developing world. From 2012 to 2015, the value of China’s arms transfer agreements with developing nations has averaged over $4 billion annually. During the period of this report, the value of China’s arms transfer agreements with developing nations was highest in 2015 at $6 billion (in current dollars)…”
“Weapons deliveries to the Near East, historically the largest purchasing region in the developing world, reflect the quantities and types delivered by both major and lesser suppliers. The following is a summary of weapons deliveries to this region for the period 2012-2015 from Table 27: United States: 52 tanks and self-propelled guns · 1APC and armored car · 45 supersonic combat aircraft · 136 artillery · 236 surface-to-air missiles · 20 anti-ship missiles Russia: 210 tanks and self-propelled guns · 10 APCs and armored cars · 40 artillery · 10 supersonic combat aircraft · 50 helicopters · 3,880 surface-to-air missiles · 60 surface-to-surface missiles China: 60 artillery · 10 APCs and armored cars · 390 surface-to-air missiles · 1 major surface combatant…” https://fas.org/sgp/crs/weapons/R44716.pdf
Top Manufacturers of Military Weapons and Systems
| 2015 SIPRI Top 100 ‘Arms-producing and military services companies’ in the world
(Excluding China; % = percent; B = Billons of US $; US = United States; UK = United Kingdom) |
|||
| Company | Country | Arms Sales $ | % of Company Sales |
| Lockheed Martin | US | 36.4 B | 79 % |
| Boeing | US | 28 B | 29 % |
| BAE Systems | UK | 25.5 B | 93 % |
| Raytheon | US | 21.8 B | 94 % |
| Northrop Grumman | US | 20 B | 86 % |
| General Dynamics | US | 19.2 B | 61 % |
| Airbus Group | Trans-European | 12.9 B | 18 % |
| BAE Systems (BAE – UK) | US | 9.7 B | 93 % |
| United Technologies | US | 9.5 B | 16 % |
| Finmeccanica | Italy | 9.3 B | 65 % |
| 7 of the top 10 Arm Sellers in 2015 were from USA and 0 from Russia | |||
| L-3 Communications | US | 8.8 B | 84 % |
| Thales | France | 8.1 B | 52 % |
| Huntington Ingalls | US | 6.7 B | 96 % |
| Almay-Antey | Russia | 6.6 B | 95 % |
| Safran | France | 5 B | 26 % |
| Harris Corp. | US | 4.9 B | 66 % |
| Rolls-Royce | UK | 4.8 B | 23 % |
| United Aircraft | Russia | 4.6 B | 80 % |
| Bechtel Corp. | US | 4.6 B | 14 % |
| United Shipbuilding | Russia | 4.5 B | 87 % |
| Top 20: 11 from USA; 3 Russia; 2 UK; 2 France; 1 Italy; 1 Trans-European | |||
| Pratt & Whitney (United Tech) | US | 4.2 B | 30 % |
| Booz Allen Hamilton | US | 3.9 B | 72 % |
| Textron | US | 3.65 B | 27 % |
| Babcock International | UK | 3.4 B | 46 % |
| Honeywell International | US | 3.38 B | 9 % |
| DCNS | France | 3.32 B | 98 % |
| Russian Helicopters | Russia | 3.3 B | 91 % |
| MBDA (BAE;EADS;Finmeccanica) | Trans-European | 3.22 B | 100 % |
| Leidos | US | 3 B | 64 % |
| Sikorsky Aircraft (Lockheed M.) | US | 3 B | 56 % |
| General Electric | US | 3 B | 3 % |
| AgustaWestland (Finmeccanica) | Italy | 3 B | 60 % |
| Mitsubishi Heavy Industries | Japan | 2.97 B | 9 % |
| Elbit Systems | Israel | 2.95 B | 95 % |
| 35 – 67 next page; some numbers rounded up .1 or .2 B | |||
| 2015 SIPRI Top 100 ‘Arms-producing and military services companies’ in the world (Page 2)
(Excluding China; % = percent; B = Billons; US = United States; UK = United Kingdom) |
|||
| Company | Country | Arms Sales | % of Company Sales |
| Rheinmetall | Germany | 2.87 B | 50 % |
| Science Applications Intern. | US | 2.85 B | 66 % |
| Israel Aerospace | Israel | 2.78 B | 75 % |
| Saab | Sweden | 2.64 B | 82 % |
| CACI International | US | 2.53 B | 68 % |
| Tactical Missiles Corp. | Russia | 2.4 B | 96 % |
| Hindustan Aeronautics | India | 2.34 B | 91 % |
| Kawasaki Heavy Industries | Japan | 2.3 B | 18 % |
| Rockwell Collins | US | 2.22 B | 42 % |
| Indian Ordnance Factories | India | 2.16 B | 98 % |
| AECOM | US | 2.15 B | 12 % |
| CSRA | US | 2.07 B | 49 % |
| Bell Helicopter (Textron) | US | 2.03 B | 59 % |
| Hewlett-Packard | US | 2 B | 2 % |
| Rafael | Israel | 1.98 B | 98 % |
| General Atomics | US | 1.97 B | ? |
| Top 50: 26 US; 5 Russia; 3 UK; 3 France; 3 Israel; 2 Italy; 2 Japan; 2 India; 1 Sweden; 1 Germany | |||
| CEA | France | 1.95 B | 43 % |
| ThyssenKrupp | Germany | 1.89 B | 4 % |
| Dassault Aviation Groupe | France | 1.85 B | 40 % |
| United Instrument Manufacturing | Russia | 1.85 B | 100 % |
| High Precision Systems | Russia | 1.77 B | 100 % |
| Selex ES (Finmeccanica) | Italy | 1.75 B | 75 % |
| Alenia Aermacchi (Finmeccanica) | Italy | 1.75 B | 51 % |
| United Engine Corp. | Russia | 1.72 B | 60 % |
| KRET | Russia | 1.68 B | 85 % |
| LIG Nex1 | South Korea | 1.68 B | 100 % |
| Total Profits for the top 25 was about $ 37 Billion just for 2015 | |||
| ST Engineering | Singapore | 1.66 B | 36 % |
| Korea Aerospace Industries | South Korea | 1.65 B | 65 % |
| Serco | UK | 1.63 B | 30 % |
| Orbital ATK | US | 1.63 B | 51 % |
| ManTech International Corp. | US | 1.42 B | 91 % |
| Fincantieri | Italy | 1.39 B | 30 % |
| GenCorp | US | 1.22 B | 71 % |
| Almost a million employees work directly for the top 10 Arms Sellers | |||
| 68 – 100 next page | |||
| 2015 SIPRI Top 100 ‘Arms-producing and military services companies’ in the world (Page 3)
(Excluding China; B = Billons; M = Millions; US = United States; UK = United Kingdom) |
|||
| Company | Country | Arms Sales | % of Company Sales |
| Polish Armaments Group | Poland | 1.19 B | 90 % |
| Vectrus | US | 1.18 B | 100 % |
| Jacobs Engineering Group | US | 1.15 B | 10 % |
| Nexter | France | 1.13 B | 95 % |
| Engility | US | 1.1 B | 53 % |
| Hanwha Techwin | South Korea | 1.08 B | 50 % |
| UMPO (United Engine Corp.) | Russia | 1.05 B | 92 % |
| Uralvagonzavod | Russia | 1.02 B | 58 % |
| For 35 of the top 100 Arms Sellers, 80% or more of their sales were Military related | |||
| DSME | South Korea | 1 B | 8 % |
| Bharat Electronics | India | 1 B | 85 % |
| ASELSAN | Turkey | 1 B | 97 % |
| DynCorp International | US | 990 M | 52 % |
| Hanwha Corp. | South Korea | 980 M | 3 % |
| Austal | Australia | 980 M | 97 % |
| GKN | UK | 950 M | 8 % |
| Oshkosh Corp. | US | 940 M | 15 % |
| QinetiQ | UK | 910 M | 79 % |
| Mitsubishi Electric Corp. | Japan | 890 M | 2 % |
| Triumph Group | US | 890 M | 23 % |
| Turkish Aerospace Industries | Turkey | 890 M | 86% |
| Pilatus Aircraft | Switzerland | 870 M | 75 % |
| Meggitt | UK | 870 M | 35 % |
| UkrOboronProm | Ukraine | 870 M | 95 % |
| Cubic Corporation | US | 860 M | 60 % |
| Moog | US | 860 M | 34 % |
| Fluor Corporation | US | 850 M | 5 % |
| Krauss-Maffei Wegmann | Germany | 840 M | 95 % |
| The Aerospace Corp. | US | 830 M | 90 % |
| RUAG | Brazil | 820 M | 45 % |
| Embraer | US | 810 M | 14 % |
| Teledyne Technologies | US | 810 M | 35 % |
| MIT | US | 800 M | 24 % |
| Due to subsidiaries SIPRI listed 110 Companies; in their last 10 were CAE of Canada; Kongsberg Gruppen of Norway; Poongsan Corporation of South Korea; and CMI of Belgium (we list 100) | |||
| Top 100 from SIPRI for 2015: 41 US; 11 Russia; 7 UK; 6 France; 3 Israel; 5 Italy; 5 South Korea; 3 Germany; 3 India; 2 Japan; 2 Turkey; 2 Trans-European; 1 Sweden; 1 Singapore; 1 Poland; 1 Australia; 1 Switzerland; 1 Ukraine; 1 Brazil; 1 Canada; 1 Norway; 1 Belgium | |||
According to OpenSecrets.org in 2017 there are 639 current defense or military focused lobbyists representing 187 clients. And they spent $33 million so far in 2017 to get or move Congress – primarily congressmen who sit on the Defense spending committees – to continue to fund weapons spending and their clients.
https://www.opensecrets.org/lobby/indus.php?id=D


The Conclusion
May 2016, theGuardian.com published the article Global armed conflicts becoming more deadly…, which stated the “International Institute for Strategic Studies says despite fewer wars number of deaths trebled since 2008 due to an ‘inexorable intensification of violence’.” They reported, “63 armed conflicts led to 56,000 fatalities in 2008, whereas 180,000 people… died in 42 conflicts last year (2015).” The number is estimated higher by many, because in Syria the situation is difficult.
Additionally, few of the Cost studies of war speak of things like ISIS’ looting of Middle Eastern artifacts from museums and cultural sites, or shooting and destroying 1000 year old mosques and formerly protected historic sites. In part ISIS sales the artifacts on the black market to fund their terror and in part they destroy to intimidate and coerce other Muslims. In addition to the Iraqi National Museum and Iraq sites, many UNESCO World Heritage sites in Syria have been damaged and plundered.
There is a significant case to be made that ISIS is a product of the Gulf Wars and conflicts. For more see: ISIS: who, what, why, how? and The ISIS Threat
Countries need to defend themselves and the world needs to take ISIS out; but who is protecting the poor families, children and guarding against the raping of taxpayers by defense contractors. No one knows the true cost: If the US can’t help pay for more college education, infrastructure, healthcare or society security; it is because the Military budget is 54% of the discretionary budget and future interest to the Federal Reserve in unknown (est. 1/4 to $1 TRILLION). Worst the Congressional Research Service estimated 20% waste in defense spending 2011-2015.
The movie ‘War Dogs (2016)’ showed a glimpse into the Defense Contracting business and how in 2007 a 21 year-old message therapist (Packouz) working with/for his 21 year-old ‘friend’ Diveroli, got a $300 million contract with the Pentagon, and would have got away with selling them re-packaged illegal Chinese ammo if the jerk Diveroli (self-made millionaire at age 18 through Defense contracts) had paid the handlers in Albania.
The United States – Saudi Arabian alliance was began during WWII about 1945, over 70 years ago, is responsible for the largest portion of funding and supplies wars and conflicts. In 2016, the Obama administration up the trade between American and the Saudi’s to about $115 billion. Then in 2017, Trump up the deal to almost triple to a reporting $300 billion.
Saudi Arabia’s massive expansion in military weapons has not only increased its navy, but has affected the continued war in Yemen between three factions, causing thousands of deaths and tens of thousands of potential refugees and orphans. It is also likely that billions of their hundred billion dollars’ worth of weapons purchased over the past administrations have ended up in the hands of ISIS and other terrorists – the same as from the U.S. It is equally likely that Saudi Arabia is building up for a future show-down with Iran and Pakistan.
We note: Russia, China, and Pakistan are members of the Shanghai Cooperation Organization and Iran is an Observer state waiting for membership (was previously stalled by U.N. sanctions); while the U.S. was turned down for observer status and Saudi Arabia is also not a member.
Who is the Shanghai Cooperation Organization (SCO)?
Timeline of Shanghai Cooperation Organization (SCO)
Other things to mention are Russia has increased its arm sales in Latin America, particularly to Venezuela. A reminder that 43 of the 100 largest military companies are U.S.-based, and that Wall Street and the financial markets are showing that the trillion dollars per approximately 3 years, led by Lockheed, Boeing, Raytheon and others, are reflected in returns and 401ks. In a substantial way average investors, like central banks and taxpayers, are keeping the coffers full for large governments to kept conflicts and wars ongoing – and even despite the UN Arms Trade Treaty of 2013, there is little that seems to differ conflict policies.
http://legal.un.org/avl/ha/att/att.html (Arms Trade Treaty)