MORAL WATCH: INDICATORS Part II
35 INDICATORS of America’s Moral Condition
This work focuses on 35 Indicators to show that direction in which our Nation is heading. The follow meter rating is for the purpose of following trends. Scale is each Moral Indicator (MI) is based on .1 to .9 with higher numbers indicating a worst condition – all multiplied by 3.176
Illegitimate Births: .85
Illegitimate births are both one of the most telling signs of immorality and a very significant factor directly related to crime, economics and changes in a nation’s culture.
According to the World Heritage Encyclopedia (2016), “in the European Union, cohabitation is very common. In 2011, 39.5% of all births in the EU 27 countries were extramarital. The percentage of births outside marriage has increased dramatically in many European countries during the last few decades… The majority of births occur outside of marriage (figures as of 2012 and 2013) in the following European countries: Iceland (66.9%), Estonia (58.4%), Slovenia (58% 2013), Bulgaria (57.4%), France (57.1% in 2013), Norway (54.9%), Sweden (54.5%), Belgium (52.3%), and Denmark (50.6%). …In late 2005, 21% of families in Finland consisted of cohabitating couples. …Generally, cohabitation amongst Finns is most common for people under 30. Legal obstacles for cohabitation were removed in 1926 in a reform of the Criminal Code, while the phenomenon was socially accepted much later on. In France, 17.5% of couples were cohabiting as of 1999. In Britain today, nearly half of babies are born to people who are not married (in the United Kingdom 47.3% in 2011; in Scotland in 2012 the proportion was 51.3%). It is estimated that by 2016, the majority of births in the UK will be to unmarried parents. The Victorian ear of the late 19th century is famous for the Victorian standards of personal morality. Historians generally agree that the middle classes held high personal moral standards and rejected cohabitation.”
In America, cohabitation was illegal until about 1970. According to an article in the Southwestern Economic Review called Determinants of the Soaring Growth of U.S. Non-Marital Births, “between 1970 and 2006 the number of non-marital births in the U.S. almost quintupled and the percentage of non-marital to total births almost quadrupled rose from 10.7% to 38.5%. In early 1973 when the Supreme Court announced the Roe v. Wade decision, few would have excepted such a development… Non-marital birth ratios for African-American as well as Hispanic and Latina women were considerably higher than the rate for white women, but these gaps were slowly narrowing…”
http://swer.wtamu.edu/sites/default/files/Data/pryor.pdf
| “The proportion of live births outside marriage in the EU-28 in 2012 was 40 %. This share has continued to increase, signalling new patterns of family formation alongside the more traditional pattern where children were born within marriage. Extramarital births occur in non-marital relationships, among cohabiting couples and to lone parents.
In 2014, extramarital births outnumbered births inside marriages in several EU Member States: Bulgaria (58.8 %), Estonia (58.4 %, 2012 data), Slovenia (58.3 %), France (56.7 %, 2012 data), Sweden (54.6 %), Denmark (52.5 %) and Belgium (52.3 %, 2012 data), as well as in Norway (55.5 %). An even higher proportion of live births outside of marriage was registered in 2012 in Iceland (66.9 %). Mediterranean countries like Greece, Croatia, Cyprus, Italy and Malta, along with Poland and Lithuania, were generally at the other end of the scale as more than 70 % of births in each of these Member States occurred within marriage; in Turkey this share was as high as 97 %. The share of children that were born outside of marriage increased in the EU-28 from 27.3 % in 2000 to 40.0 % in 2012. Looking at the latest available data, extramarital births increased in almost every EU Member State in 2014 compared with 2013 (2012 compared with 2011 for some Member States), with the exceptions of Estonia (2012 compared with 2011), Latvia, Lithuania and Bulgaria.” http://ec.europa.eu/eurostat/statistics-explained/index.php/Marriage_and_divorce_statistics |
According to the Brookings Report (1996), An Analysis of Out-of-Wedlock Births in the United States, “In 1970 there were about 400,000 out-of-wedlock births out of 3.7 million total births. In 1990 there were 1.2 million out-of-wedlock births out of 4 million total. From the late 1960s to the late 1980s, the number of births per unmarried woman roughly doubled for whites, but fell by 5-10 percent for blacks. The fraction of unmarried women rose about 30 percent for whites, about 40 percent for blacks. The fertility rates for married women of both races declined rapidly (also, of course, contributing to the rise in the out-of-wedlock birth ratio).
If the increased abortions and use of contraceptives caused the rise in out-of-wedlock births, the increase would have to have been very large relative to the number of those births and to the number of unmarried women. And as table 1 shows, that was indeed the case. The use of birth control pills at first intercourse by unmarried women jumped from 6 percent to 15 percent in just a few years, a change that suggests that a much larger fraction of all sexually active unmarried women began using the pill. The number of abortions to unmarried women grew from roughly 100,000 a year in the late 1960s (compared with some 322,000 out-of-wedlock births) to more than 1.2 million (compared with 715,000 out-of-wedlock births) in the early 1980s. Thus the data do support the theory.
Indeed, the technology shock theory explains not only the increase in the out-of-wedlock birth rate, but also related changes in family structure and sexual practice, such as the sharp decline in the number of children put up for adoption. The peak year for adoptions in the United States was 1970, the year of the technology shock. In the five years following the shock the number of agency adoptions was halved from 86,000 to 43,000. In 1969, mothers of out-of-wedlock children who had not married after three years kept only 28 percent of those children. In 1984, that rate was 56 percent; by the late 1980s it was 66 percent.”
https://www.brookings.edu/research/an-analysis-of-out-of-wedlock-births-in-the-united-states/
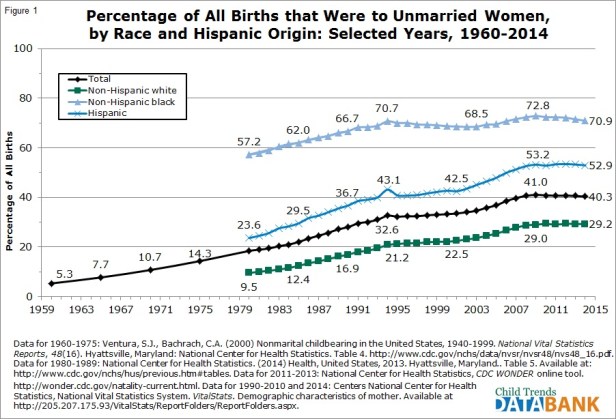
According to ChildTrends.org, (2015), “Children born to unmarried mothers are more likely to grow up in a single-parent household, experience instable living arrangements, live in poverty, and have socio-emotional problems. As these children reach adolescence, they are more likely to have low educational attainment, engage in sex at a younger age, and have a birth outside of marriage. As young adults, children born outside of marriage are more likely to be idle (neither in school nor employed), have lower occupational status and income, and have more troubled marriages and more divorces than those born to married parents. The proportion of births to unmarried women has increased greatly in recent decades, rising from five percent in 1960 to 32 percent in 1995. After some stability in the mid-1990s, there was a gradual rise from 1997 through 2008, from 32 to 41 percent. The rate appears to have stabilized again, and was at 40 percent in 2014. ”
http://www.childtrends.org/indicators/births-to-unmarried-women/
Teen Pregnancy: .78
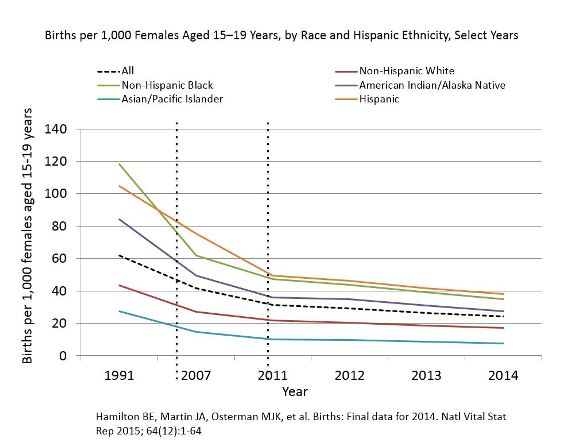
The teen birth rate has significantly dropped; or the 4 million births in 2012, 305,000 were to teens between the ages of 15 and 19. Between 1990 and 2012, the rate was halved from 60 births per 1000 to 29 for that age bracket.
According to the CDC, in 2010, teen pregnancy and childbirth accounted for at least $9.4 billion in costs for increased health care and foster care, as well as increased incarceration rates among children of teen parents. About 90% of women that graduate from high school do not have teen pregnancies. The DHHS reported that in 2014, 1 in 6 teen births were to females who already had one or more babies. ‘Birth rates are higher among Hispanic and black adolescents…’ They also noted that although the U.S. rate has fallen, it is ‘higher than that of many other developed countries, including Canada and the U.K.’
The fact that the rate has decline does not absolutely indicate a pure rise in morals. The desire to wait for children, the use of birth control, government issued birth control, and earlier sex educations are factors in this decline. Additionally, the rate is not equally related to the rate of fornication. However, a sexually active teen that does not use contraceptives has about a 90% chance of becoming pregnant within a year. And about 85% of teen pregnancies are unplanned.
According to the DHHS Teen Pregnancy Prevention Evidence Review, findings July 2014 to August 2015 revealed that ‘classroom-based curricula for middle school students to specialized initiatives to prevent rapid repeating pregnancies among teen mothers… showed 7 or the 16 programs… had favorable’ results.
Parenthood is the number one reason that teen girls drop out of school, which directly affects their future. Less than 2% of teen moms earn a college degree by age 30. More over 8 of 10 teen dads do not marry the mother of their child.
Approximately 40% of females become pregnant before age 20; half of these pregnant teens give birth each year and about 45% have abortions, while less than 15% put their children up for adoption – which was much more common generations ago. Abortion rates are directly related to teen pregnancy rates.
ABORTIONS: .85
The number of abortions in the United States since the Roe v. Wade decision in 1973 is estimated between 55 and 60 million (2016). According to Guttmacher about 2009 the number began to level off and since 2010 has been just over a million each year. CDC numbers have always been at least 10-20% lower. CDC admits undercounts because they stopped reporting estimates for some states in 1998, including California.
Abortions peaked around 1980 at a rate of about 29.3 per 1000 women. And the rate was about 17 per 1000 in 2011. The CDC stated that in 2013, about 37% of all pregnancies in New York City (excluding miscarriages) ended in abortions. In 2013, a third of women who had abortions were 20 and 24 years old; another third were 25 to 31; with 11% ages 15 to 19. Unmarried women accounted for over 85% of all abortions. About 70% of abortions occurred in the first 2 months; however about 8% occurred after the first trimester.
In 1972, 24 women died from legal abortions and 39 died from illegal abortion complications. And less than 500 have died between 1973 and 2016 from abortions; thus, the law was more related to politics, morality and culture, than safety. About 40% of minors that had abortions did not notify their parents; 39 states now require parental consent or a court order authorizing the procedure. Raped victims that report the crimes are typically offered an abortion pill if within about 3 days of the incident.
One third of all pregnancies worldwide are unplanned. It is felt that laws do not deter abortions. Abortions procedures are most often unsafe when not performed by a doctor; and a significant percentage of unsafe abortions lead to medical problems.
Only a very small percentage of women feel forced to have an abortion. About half of all women having abortions had that mount used some form of contraception – usually the pill or a condom. In 2011, the rate of abortions per 100 pregnancies was about 21. Abortion is the leading cause of death in the U.S. and likely in the world; almost equal to deaths to both heart disease and cancer. 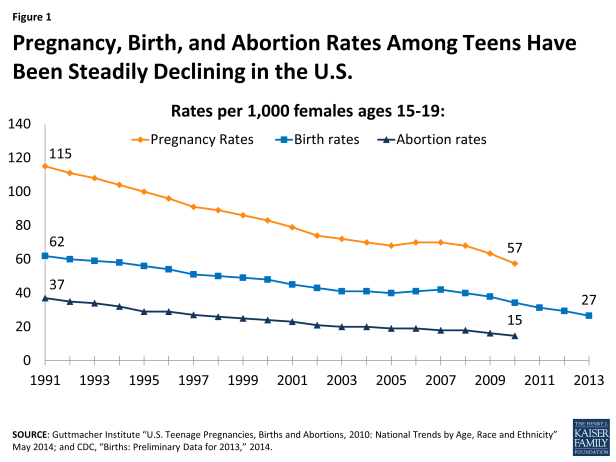
Note: Abortion rates in the U.S. have fallen significantly because pregnancy and birth rates have fallen. In some states, the ratio of abortions per 100 pregnancies has increased. Therefore, it is not directly due to better morals that rates have drop per the general population.
For statistics: http://www.nrlc.org/uploads/factsheets/FS01AbortionintheUS.pdf
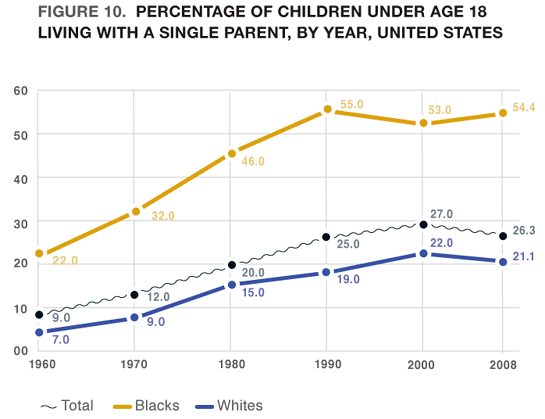
Single Parent Homes: .87
Not all single parent homes indicate a negative moral factor. However, single parent families are a significant indicator of culture and morality. Young children in single parent homes are innocent and almost never have a choice of their surroundings. Yet, statistics show that a much greater percentage of criminals and cohabitors come out of single parent homes as opposed to homes with both parents.
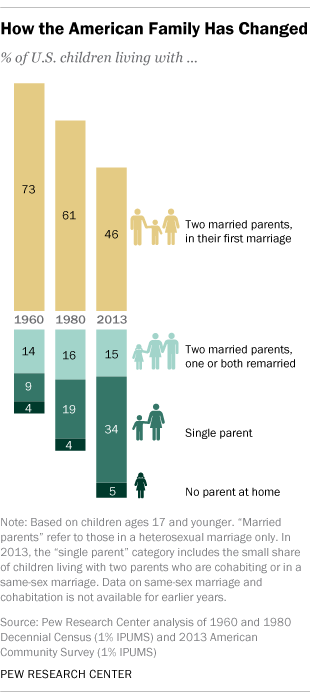
Nevertheless, over 24 million children were in single parent homes in 2014, which was about 35% of all children. About 2/3rds (66%) of all Black or African American children are in single parent homes; about 42% of Hispanic and 25% of White in 2014.
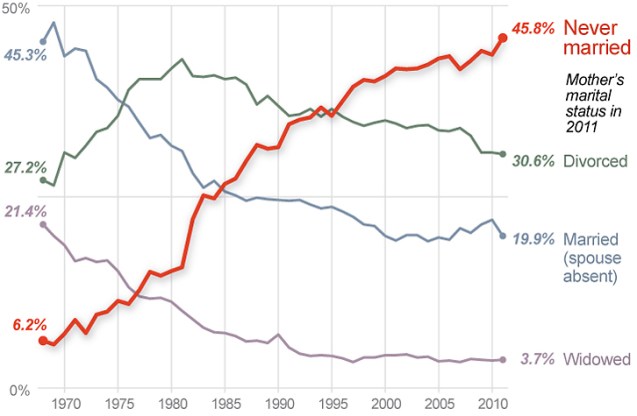
Above: Children in Single Parent Homes by Type
In a 2010 Data Brief, U.S. Children in Single-Mother Families, according to the Population Reference Bureau (PRB.org), “in the United States, the number of children in single-mother families has risen dramatically over the past four decades, causing considerable concern among policymakers and the public. Researchers have identified the rise in single-parent families (especially mother-child families) as a major factor driving the long-term increase in child poverty in the United States. The effects of growing up in single-parent households have been shown to go beyond economics, increasing the risk of children dropping out of school, disconnecting from the labor force, and becoming teen parents. Although many children growing up in single-parent families succeed, others will face significant challenges in making the transition to adulthood. Children in lower income, single-parent families face the most significant barriers to success in school and the work force.”